First and foremost, my apologies for the lack of updates for the past 2 weeks or so as I have been busy with house moving (glad that everything at the end of the day happened smoothly, and that I’m now pretty much settled down in my new place, except for a few more boxes left to open up and unpack, along with some tidying up to go.)
As it has been quite a while since I did a technical analysis review on the possible movements of the indexes in Singapore (namely the Straits Times Index, or STI), Hong Kong (in the Hang Seng Index, or the HSI), as well as in the United States (in the S&P 500, Dow Jones Industrial Average, and the NASDAQ), I thought it would be timely to write a post today to share with you my personal thoughts on how these indexes may possibly move in the near term, along with some of the key support and resistance levels (I’ve identified) to take note of.
Let’s get started:
1. Straits Times Index (STI)

At the time of writing (Monday, 07 June 2021, at 9.25am), Singapore’s Straits Times Index is up by 0.75% (compared to the close of the last trading session last Friday) at around 3,175 points.
In terms of the technical indicators I’ve used, MACD is in an uptrend position, while the stochastic, even though it’s about to turn into an uptrend position as well, but it is at an overbought level.
At this point, the index could move in either direction – should it continue to remain bullish, the index could move up towards the 3,190 level before retracing downwards; however, if it can break above this immediate resistance line, then the next resistance line is at 3,220 points.
Should the movement of the index turns bearish, then it may possible move down towards the immediate support line at around the 3,145 level.
2. Hang Seng Index (HSI)
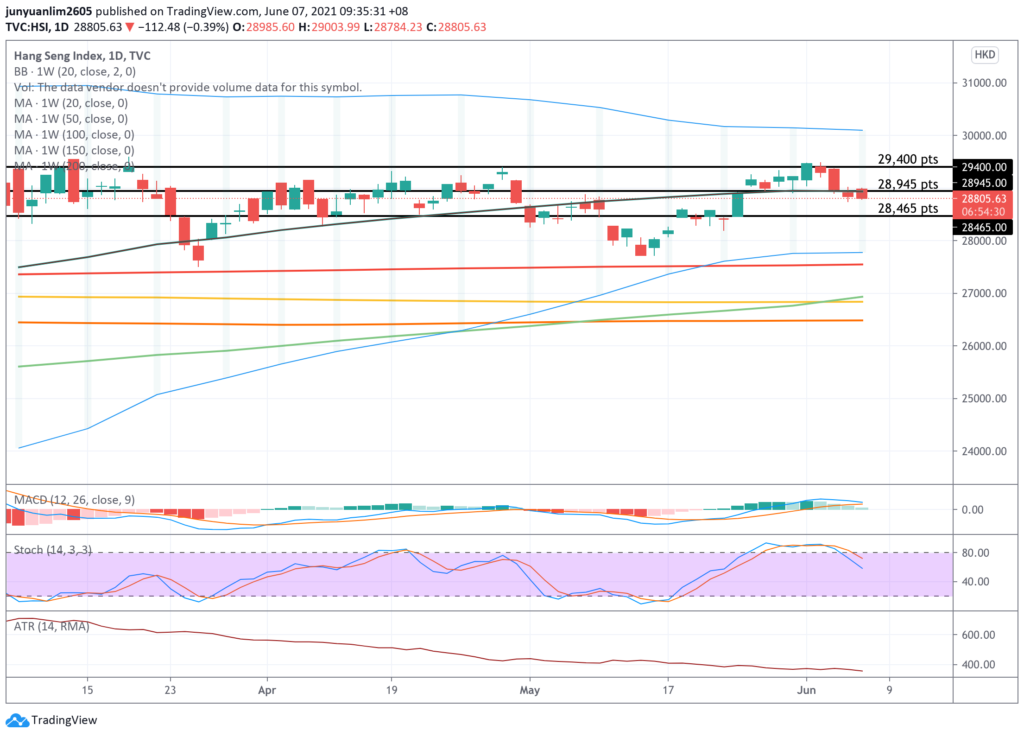
The Hong Kong market have also just opened for the day as I’m writing this post – as at Monday, 07 June 2021, at around 09.35am, the Hang Seng Index is down by around 0.45% (compared to the close of the previous trading session last Friday) to 28,805 points.
Looking at the candlestick pattern over the past 4 sessions, they are all in red (meaning they have closed lower compared to the previous session.) In the process, it even broke under the 20-day moving average support line (on a weekly timeframe) at around the 28,945 level.
In terms of its technical indicators, stochastic is in a downtrend, and MACD looks like its about to reverse into a downtrend as well – both suggesting that in the near-term, the index is likely to weaken – my personal analysis is that the index could possibly reverse to around the 28,465 level (where there is an immediate support.)
However, should the movement reverse (and go back up), it will need to first break above the support-turned-resistance level at the 20-day moving average (on a weekly timeframe) at the same 28,945 level, and if the upward movement remains intact, then it could possibly move up to the 29,400 level – where the next resistance line is.
3. S&P 500
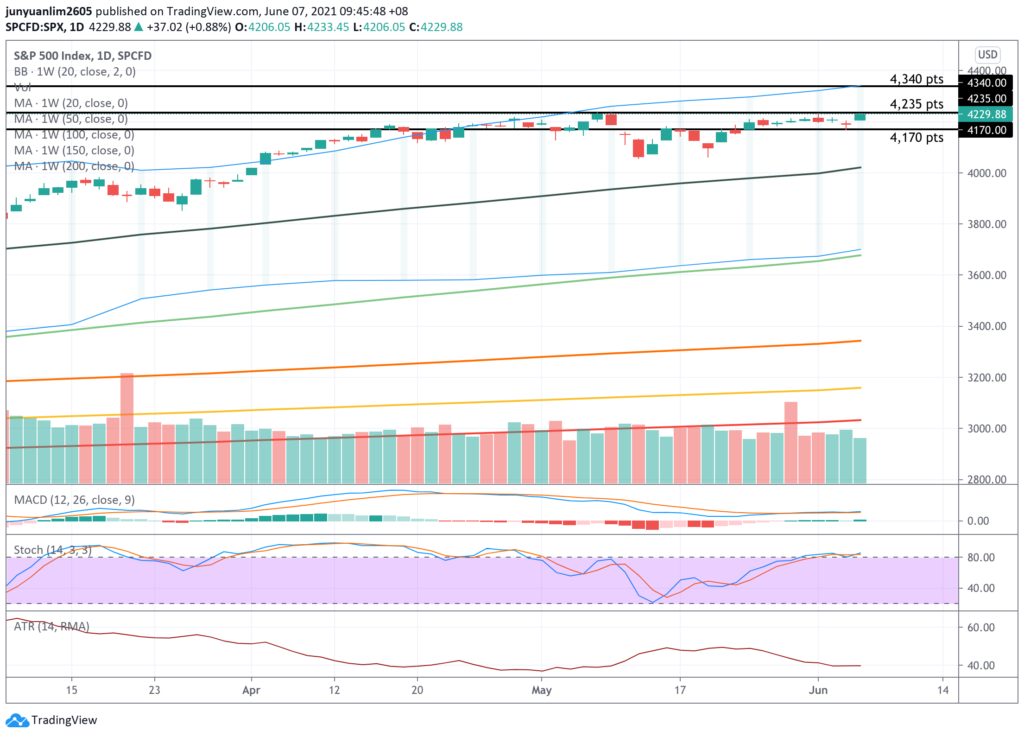
The United States’ S&P 500 index closed at 4,229 points when the market closed last Friday (04 June 2021) – just a whisker away from its current 52-week high at 4,238 points.
In terms of its technical indicators, both the MACD as well as stochastic are in an uptrend – but do take note that the latter is already in an overbought territory, a signal that further upside could be limited.
Should the index were to continue to move up in the coming days, in my opinion, it could go up to around the 4,235 level (where there is a resistance line to be found) before retracing down to around the 4,170 level (where the immediate support line is.)
On the other hand, should the index were to break above the 4,235 level, then the next resistance could be found at around the 4,340 level (where the upper band of the Bollinger Band on a weekly timeframe is, and also a new high for the index.)
4. Dow Jones Industrial Average

The movement of the Dow Jones is very similar to the S&P 500, in that at close last Friday (04 June 2021), the index is very close to its current 52-week high of 35,901 points.
Also, in terms of its technical indicators, both the MACD as well as stochastic are also in an uptrend, with the latter in an overbought level, suggesting that further upsides could be limited.
On the possible support/resistance levels, in my personal opinion, the index could go up towards the 34,820 level (where the immediate resistance line is) before it retraces back down to the 34,320 level (where the immediate support line is.) However, should the index were to be able to break above the 34,820 resistance line, then we may possibly see the index heading up towards a new high of 36,000 level (where the upper band of the Bollinger Band on a weekly timeframe is.)
5. NASDAQ

Finally, let us have a look at the NASDAQ – as at the close of the market last Friday (04 June 2021), the index is at 13,814 points – if you notice from the chart above, at its current level, it is very close to the immediate resistance line (which I’ve identified) at around the 13,825 level.
Looking at the technical indicators MACD and stochastic, the former is in an uptrend, while the latter looks like its about to turn into an uptrend once again (however, do bear in mind that it is already in an overbought territory currently – a sign which suggests that further upside could be limited.)
In my personal opinion, 2 scenarios could happen in the near-term – in a bullish scenario, the index could break above the most immediate resistance line (found at the 13,825 level) and continue to move towards the next resistance line at around the 14,160 level; on the other hand, the index could also retrace down towards the most immediate support line at around the 13,590 level.
Closing Thoughts
Apart from Hong Kong’s Hang Seng Index, all the other indexes I have looked at all have their stochastic at overbought levels. I have also identified the various support and resistance lines the index may be headed towards in a bullish and bearish scenario respectively.
However, do take note that everything you have just read in this post is based on my personal technical analysis which I am sharing for educational purposes only.
I hope you find today’s share useful, and I look forward to sharing more in the coming days, weeks, and months ahead (do give me some time to come up with the posts, and I’ll publish them when they are ready.) Till then, here’s wishing all of you a great trading week ahead. Take care and stay safe!
Are You Worried about Not Having Enough Money for Retirement?
You're not alone. According to the OCBC Financial Wellness Index, only 62% of people in their 20s and 56% of people in their 30s are confident that they will have enough money to retire.
But there is still time to take action. One way to ensure that you have a comfortable retirement is to invest in real estate investment trusts (REITs).
In 'Building Your REIT-irement Portfolio' which I've authored, you will learn everything you need to know to build a successful REIT investment portfolio, including a list of 9 things to look at to determine whether a REIT is worthy of your investment, 1 simple method to help you maximise your returns from your REIT investment, 4 signs of 'red flags' to look out for and what you can do as a shareholder, and more!

You can find out more about the book, and grab your copy (ebook or physical book) here...


Comments (0)