Apart from OCBC (I’ve reviewed on the bank’s results over the past 9 years, and also reasons for my investment back then here), another company I’ve added to my long-term investment portfolio in 2019 was Ascendas REIT (SGX:A17U) – with my invested price at $2.93 back when its unit price fell due to the REIT’s launch of a preferential offering where the issue price range was between $2.96 and $3.05 for each unit (you can check out more information about the REIT’s fund raising exercise then in this document). In case you’re wondering what the yield was back then, I based it on its full year payout in FY2018 of 16.035 cents/unit, and it was at 5.5% – which satisfies my requirement of my investments giving me a minimum of a 4.0% yield. No doubt its distribution in FY2020 have fallen a little compared to FY2018/19 (at 14.688 cents/unit), but at my invested price, it was still yielding at 5.0%.
As its been about than 2 years since I’ve invested in the REIT, I thought it may be timely for me to do a review to find out whether or not its key financial results, portfolio occupancy, and debt profile still continued to remain resilient, and also at the same time whether its distribution payouts managed to continue improving after I’ve added it to my long-term investment portfolio – I’ll be taking a look at the statistics recorded between FY2011/12 (when the REIT still had a financial year end every 31 March, until CapitaLand’s acquisition of the REIT and with effect from 24 July 2019, where its financial year end have been switched to 31 December, in-line with the financial year end of all its companies – you can read the announcement here) and FY2020:
Financial Performance
As mentioned in the introductory paragraph above, I will be looking at the REIT’s key financial performances recorded over a 10 year period – between FY2011/12 and FY2020:
| FY 2011/12 | FY 2012/13 | FY 2013/14 | FY 2014/15 | FY 2015/16 | |
| Gross Revenue (S$’mil) | $503.3m | $575.8m | $613.6m | $673.5m | $761.0m |
| Net Property Income (S$’mil) | $368.3m | $408.8m | $436.0m | $462.7m | $533.7m |
| Distributable Income to Unitholders (S$’mil) | $281.7m | $305.6m | $342.0m | $351.1m | $378.3m |
| FY 2016/17 | FY 2017/18 | FY 2018/19 | FY2019 | FY2020 | |
| Gross Revenue (S$’mil) | $830.6m | $862.1m | $886.2m | $699.1m | $1,049.5m |
| Net Property Income (S$’mil) | $611.0m | $629.4m | $649.6m | $537.7m | $776.2m |
| Distributable Income to Unitholders (S$’mil) | $446.3m | $468.0m | $485.7m | $375.4m | $538.4m |
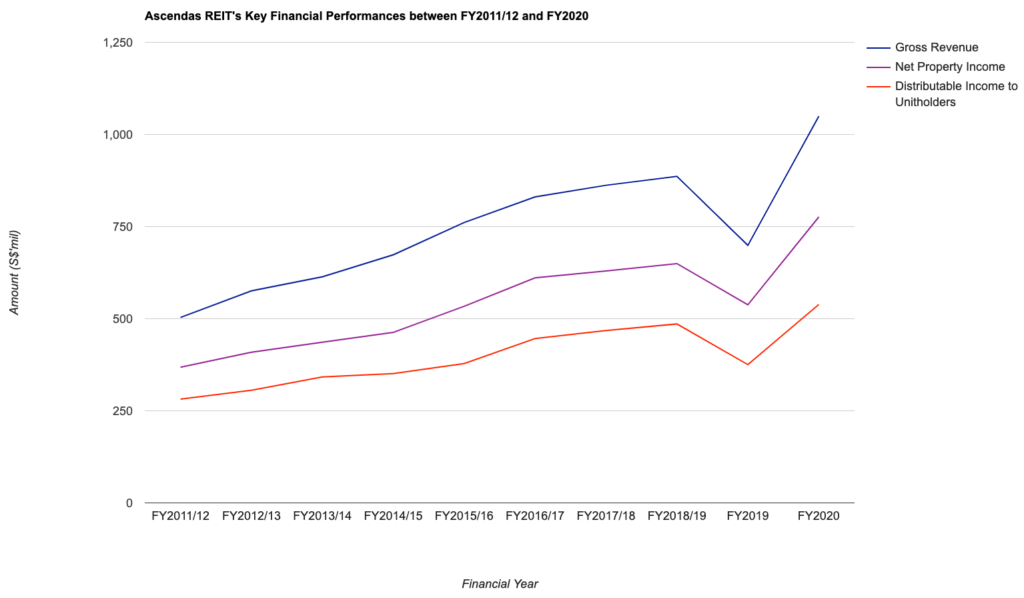
I’m sure you’ll agree with me that the REIT’s results over the past 10 years is an impressive one, where it has recorded year-on-year (y-o-y) improvements in terms of its top- and bottom-line almost every single year except for one – and that was in FY2019, where particular financial year was for a period of 9 months (between 01 April and 31 December 2019 as a result of its financial year changing from 31 March to 31 December.)
In terms of the compound annual growth rate (CAGR), over a 10 year period, its gross revenue and net property income saw a 8% CAGR growth, while its distributable income to unitholders saw a 7% CAGR growth – which in my opinion is a pretty impressive one.
Portfolio Occupancy Profile
Next, let us take a look at the REIT’s portfolio occupancy profile over the same time period (between FY2011/12 and FY2020) – where my requirements are that REITs I invest in must have a high occupancy rate (above 90.0% at least), and also preferably, rental reversions for new/renewed leases have to be at a positive percentage for most years (as many years of negative reversions may result in the REIT’s financial results being impacted.)
So, over the last 10 years, did Ascendas REIT’s portfolio occupancy profile fulfil my requirements? Let’s take a look at the statistics in the table below:
| FY 2011/12 | FY 2012/13 | FY 2013/14 | FY 2014/15 | FY 2015/16 | |
| Portfolio Occupancy (%) | 94.3% | 94.0% | 89.6% | 87.7% | 87.6% |
| WALE (by Gross Revenue – years) | 4.0 years | 3.7 years | 3.9 years | 3.8 years | 3.7 years |
| Rental Reversion (%) | +5.2% to +15.7% | +14.0% | +14.8% | +8.3% | +7.0% |
| FY 2016/17 | FY 2017/18 | FY 2018/19 | FY2019 | FY2020 | |
| Portfolio Occupancy (%) | 90.2% | 91.5% | 91.9% | 90.9% | 91.7% |
| WALE (by Gross Revenue – years) | 4.3 years | 4.2 years | 4.2 years | 3.9 years | 4.1 years |
| Rental Reversion (%) | +3.1% | +0.7% | +3.7% | +6.0% | +3.8% |
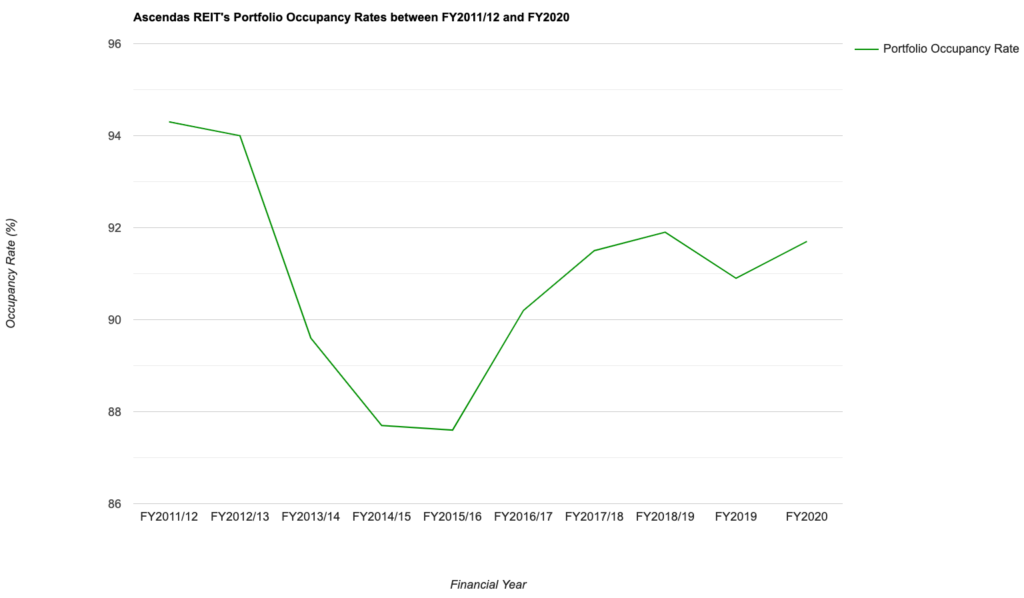
My Observations: Apart from the financial years between FY2013/14 and FY2015/16 where its overall portfolio occupancy rate fell below 90% and recorded declines in successive years (in FY2013/14, due to a dip in occupancy rate in its business park, hi-specs industrial, and light industrial properties, offset by an improvement in the occupancy rate in its logistics properties; in FY2014/15, it was due to a further dip in occupancy rate in its hi-specs industrial properties compared to the previous financial year; and in FY2015/16, it was due to a dip in occupancy rate in its business park properties), the remaining 7 years saw the REIT being able to maintain a portfolio occupancy rate of above 90.0%.
As far as its rental reversion over the last 10 years is concerned, it has managed to remain in positive figures (and this attributed to improvements in its financial results over the years.) What impressed me the most is that in FY2020, despite of all the headwinds posed by the Covid-19 pandemic (particularly with many businesses being disrupted as a result of lockdowns implemented in many countries), the REIT still managed to record a positive +3.8% rental reversion for new/renewed leases.
Finally, in terms of its portfolio weighted average lease expiry (WALE), it has remained consistent over the years – which is something I like as well.
Debt Profile
When it comes to my selection criteria as far as a REIT’s debt profile is concerned – at the minimum, my preference is towards those that were able to maintain its aggregate leverage (or gearing level, as some would like to refer to it as) at below 35% (back when its regulatory level was at 45.0%), and now below 40% (when its regulatory level has been increased to 50.0% from 16 April 2020 – you can read the full report published by the Monetary Authority of Singapore, or the MAS, here), as well as its interest coverage ratio (in layman terms, it computes how well a company can keep up with its interest payments, and it can be calculated by taking its earnings before interest and taxes divided by interest expense) at 5.0x or more.
You can find Ascendas REIT’s debt profile over the past 10 years (between FY2011/12 and FY2020) in the table below:
| FY 2011/12 | FY 2012/13 | FY 2013/14 | FY 2014/15 | FY 2015/16 | |
| Aggregate Leverage (%) | 36.6% | 28.3% | 30.0% | 33.5% | 37.3% |
| Internet Coverage Ratio (times) | 5.3x | 4.9x | 6.0x | 6.1x | 5.5x |
| Average Term to Debt Maturity (%) | 3.5 years | 3.9 years | 3.3 years | 3.6 years | 3.4 years |
| Average Cost of Debt (%) | 2.8% | 3.3% | 2.7% | 2.7% | 2.8% |
| FY 2016/17 | FY 2017/18 | FY 2018/19 | FY2019 | FY2020 | |
| Aggregate Leverage (%) | 33.8% | 34.4% | 36.3% | 35.1% | 32.8% |
| Internet Coverage Ratio (times) | 5.7x | 5.9x | 5.2x | 5.1x | 4.3x |
| Average Term to Debt Maturity (%) | 3.3 years | 3.2 years | 4.0 years | 4.0 years | 3.7 years |
| Average Cost of Debt (%) | 3.0% | 2.9% | 3.0% | 2.9% | 2.7% |

My Observations: As far was its aggregate leverage is concerned, I like it for the fact that it has been kept below 35.0% (before FY2020, when the regulatory limit was still at 45.0%), and in FY2020 when the regulatory limit has been increased to 50.0%, it was at 32.8% – leaving a huge debt headroom for the REIT to be able to embark on even more yield-accretive acquisitions.
Interest coverage ratio was also held at above 5.0x in 9 out of 10 years (the only year which the interest coverage fell below this level was in FY2012/13.)
Finally, its average term to debt maturity, as well as its average cost of debt over the past 10 financial years have also largely remained consistent, which is good to note.
Distribution Payout to Unitholders
Before FY2020, where companies still had to post their full financial results on a quarterly basis, Ascendas REIT’s distribution payout frequency was once every quarter (this was also one of the reasons why I’ve made the investment decision on the REIT, as I preferred those that were able to pay out a distribution on a quarterly basis.)
However, from FY2020, as companies are no longer mandated to post their full financial results on a quarterly basis, they have changed their distribution payout frequency to once every 6 months – once when they release their second quarter results (with payout around November) and once when they release their fourth quarter results (with payout around February.)
The following table is the REIT’s distribution payout to its unitholders over the past 10 years (between FY2011/12 and FY2020):
| FY 2011/12 | FY 2012/13 | FY 2013/14 | FY 2014/15 | FY 2015/16 | |
| Distribution Per Unit (S$’cents) | 13.56 cents | 13.74 cents | 14.24 cents | 14.6 cents | 15.357 cents |
| FY 2016/17 | FY 2017/18 | FY 2018/19 | FY2019 | FY2020 | |
| Distribution Per Unit (S$’cents) | 15.743 cents | 15.988 cents | 16.035 cents | 11.49 cents | 14.688 cents |
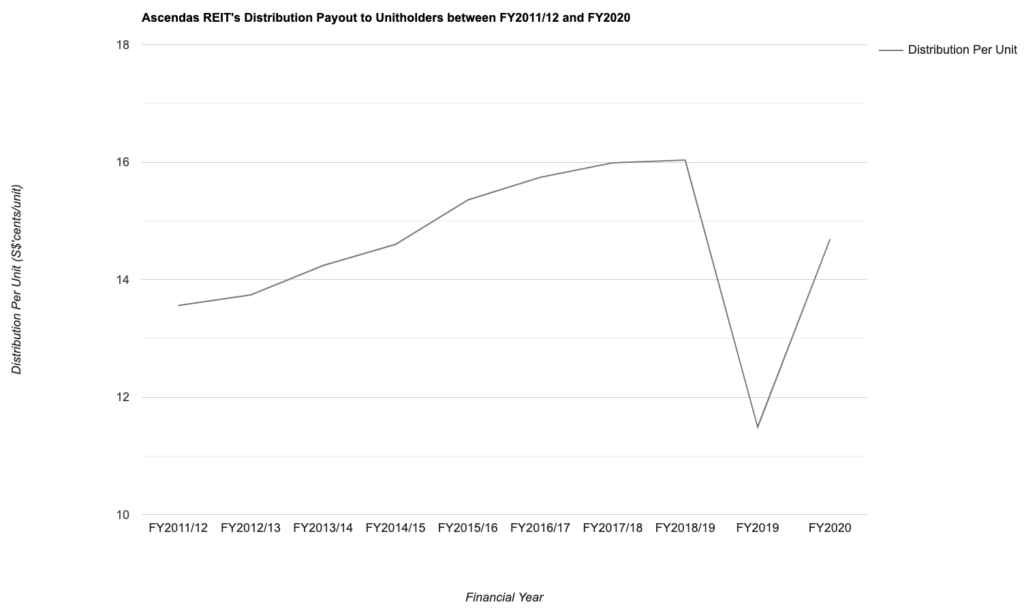
Apart from in FY2019 (due to the fact that there’s only 9 months worth of results, and as such, its distribution payouts fell when compared to the previous financial year, which has 12 months worth of results), all the remaining 9 years saw the REIT increasing its distribution payouts to unitholders on a y-o-y basis.
Over a 10-year period, its distribution payout saw a 1% CAGR growth.
Closing Thoughts
When it comes to putting my money into companies, my preference is towards those that are able to grow their financial results, along with their dividend payouts over the years. Also, for the case of a REIT, I will also first make sure that its portfolio occupancy is a resilient one, along with its debt profile being healthy before investing in it.
For the case of Ascendas REIT, it fulfils all the requirements I have set out, and hence my decision to invest in it back in November 2019.
I hope you’ve found the contents presented above useful, and with that, I’ve come to the end of my share on the performance of Ascendas REIT over a 10-year period. Do take note that everything you’ve just read about above is purely for educational purposes only. They do not represent any buy or sell calls for the REIT’s units. You should always do your own due diligence before making any investment decisions.
Disclaimer: At the time of writing, I am a unitholder of Ascendas REIT.
Are You Worried about Not Having Enough Money for Retirement?
You're not alone. According to the OCBC Financial Wellness Index, only 62% of people in their 20s and 56% of people in their 30s are confident that they will have enough money to retire.
But there is still time to take action. One way to ensure that you have a comfortable retirement is to invest in real estate investment trusts (REITs).
In 'Building Your REIT-irement Portfolio' which I've authored, you will learn everything you need to know to build a successful REIT investment portfolio, including a list of 9 things to look at to determine whether a REIT is worthy of your investment, 1 simple method to help you maximise your returns from your REIT investment, 4 signs of 'red flags' to look out for and what you can do as a shareholder, and more!

You can find out more about the book, and grab your copy (ebook or physical book) here...


Comments (2)