Suntec REIT (SGX:T82U), with retail, office, as well as convention centre assets in Singapore, Australia, as well as in the United Kingdom, is another REIT I have added to my long-term investment portfolio back in end-February 2020 at $1.75 – in a nutshell, the reasons why I’ve made the investment decision was because of its consistency in terms of its financial performance over the years, a resilient property portfolio occupancy profile (more on that in the sections below), and that the REIT is one of the few which pays out a quarterly distribution payout to its unitholders (and it has continued to do so.)
As it has been coming to 2 years since I’ve invested in this REIT, I thought it may be timely for me to do a review about it today – where you’ll read about its financial performance, portfolio occupancy, and its debt profile, along with its distribution payout to unitholders over the past 9 years (between FY2012 and FY2020.) You’ll also read about reasons why I did not average down on the REIT at this point in time, as well as also my outlook for it in the year ahead.
But first, a brief introduction about the REIT for those of you who may be unfamiliar:
A Brief Introduction about Suntec REIT
Listed on 09 December 2004 on the Main Board of the Singapore Exchange Securities Trading Limited, at the time of writing, Suntec REIT’s property portfolio comprises of retail, office, and convention centre assets located in Singapore, Australia, and in the United Kingdom, where its assets include:
Singapore:
- Suntec City Mall (100.0% interest)
- Suntec City Office Towers (59.0% interest)
- Suntec Singapore Convention and Exhibition Centre (66.3% interest)
- One Raffles Quay (33.3% interest)
- Marina Bay Financial Centre Towers 1 and 2, and Marina Bay Link Mall (33.3% interest)
Australia:
- 177 Pacific Highway, New South Wales (100.0% interest)
- 21 Harris Street, New South Wales (100.0% interest)
- Southgate Complex, Victoria (50.0% interest)
- Olderfleet, 477 Collins Street, Victoria (50.0% interest)
- 55 Currie Street, Adelaide (100.0% interest)
United Kingdom:
- Nova Properties, London (50.0% interest)
- The Minster Building, London (100.0% interest)
Its Australia properties are sitting on freehold land, while its Singapore and United Kingdom properties are sitting on leasehold land.
Financial Performance
Suntec REIT has a financial year ending every 31 December. With that, in this section, you’ll learn about some of the REIT’s key financial results recorded over the past 9 years – between FY2012 and FY2020:
| FY2012 | FY2013 | FY2014 | FY2015 | FY2016 | |
| Gross Revenue (S$’mil) | $261.9m | $234.1m | $282.4m | $329.5m | $328.6m |
| Net Property Income (S$’mil) | $163.4m | $148.7m | $191.6m | $229.2m | $224.6m |
| Distributable Income to Unitholders (S$’mil) | $213.0m | $211.6m | $230.3m | $252.0m | $253.7m |
| FY2017 | FY2018 | FY2019 | FY2020 | ||
| Gross Revenue (S$’mil) | $354.2m | $363.5m | $366.7m | $315.4m | |
| Net Property Income (S$’mil) | $244.5m | $241.0m | $236.2m | $199.9m | |
| Distributable Income to Unitholders (S$’mil) | $263.0m | $266.8m | $262.7m | $209.2m |
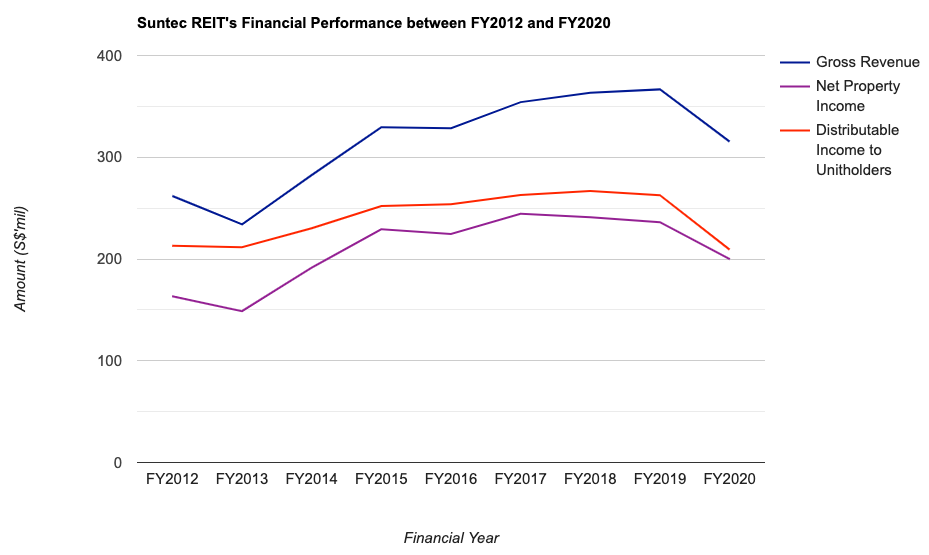
As you can see from chart above, its gross revenue and net property income have moved up gradually over the years – and over a 9 year period, it has recorded a compound annual growth rate of about 2% – while not fantastic, but I consider its growth over the years a stable one.
For those of you who are wondering about the reason for the year-on-year (y-o-y) decline in its gross revenue in 3 out of the 9 years I have looked at, they are as follows:
FY2013: Due to the partial closure of Suntec City Mall for asset enhancement works during the financial year;
FY2016: The slight dip was due to the lack of income contribution from Park Mall after the divestment;
FY2020: Mainly attributed from lower income contribution from Suntec City Mall, as well as from Suntec Singapore Convention and Exhibition Centre, due to the ongoing Covid-19 pandemic and safe management measures were implemented to slowdown the community spread.
Portfolio Occupancy
In the following table, you’ll find the occupancy rates of Suntec REIT’s properties breakdown by property type, as well as by geographical location:
| Occupancy Rate | FY2012 | FY2013 | FY2014 | FY2015 | FY2016 |
| Retail (Singapore) | 98.1% | 99.7% | 97.3% | 97.9% | 97.9% |
| Office (Singapore) | 99.7% | 100.0% | 99.6% | 99.3% | 99.3% |
| Retail (Australia) | N.A. | N.A. | N.A. | N.A. | 89.0% |
| Retail (Office) | N.A. | N.A. | N.A. | N.A. | 95.9% |
| Office (United Kingdom) | N.A. | N.A. | N.A. | N.A. | N.A. |
| Occupancy Rate | FY2017 | FY2018 | FY2019 | FY2020 | |
| Retail (Singapore) | 99.0% | 99.6% | 99.5% | 90.2% | |
| Office (Singapore) | 99.7% | 98.5% | 99.1% | 96.7% | |
| Retail (Australia) | 91.7% | 90.9% | 92.8% | 91.7% | |
| Retail (Office) | 97.3% | 99.4% | 97.8% | 94.0% | |
| Office (United Kingdom) | N.A. | N.A. | N.A. | 100.0% |
My Observations: On the whole, I felt that the occupancy rate of Suntec REIT’s properties have by and large remained resilient – where on most years, the occupancy rates were maintained at 90.0% and above.
Also, for the year 2020, its Singapore office properties’ occupancy rate, at 96.7%, is higher than the overall CBD occupancy rate of 93.2%. The same can be said for the occupancy rate of its Australia office properties, where, at 94.0%, was higher than the Nationwide CBD 3Q20 office occupancy of 87.8%. Its United Kingdom office (as at the end of FY2020 it only consist of Nova Properties) was 100.0% occupied, and this was above the Central London 3Q20 office occupancy of 94.1%.
The only asset type which was below the market occupancy rate was its retail properties in Singapore, where, at 90.2% recorded in FY2020, was below the 92.6% secondary market occupancy rate – Personally, I wasn’t surprised by this because for most parts of the financial year 2020, working from home was the default, resulting in footfall to the REIT’s malls (which were all located in the CBD area) adversely impacted – this also led to tenant sales decreasing and tenants eventually choosing not to renew their leases when they expired.
Looking forward, I’m of the opinion that the Singapore government is looking at allowing people to return to their workplaces once again in the new year ahead considering a huge percentage of Singapore’s population has been fully vaccinated (this is provided that the new Omicron variant does not lead to Singapore’s hospitals being overloaded once again, and requiring the Singapore government to roll back some of the safe management measures), and the REIT’s retail malls should see an improvement in its footfall and tenant sales.
Debt Profile
Moving on, let us take a look at the REIT’s debt profile recorded over the last 9 years – between FY2012 and FY2020, in the table below:
| FY2012 | FY2013 | FY2014 | FY2015 | FY2016 | |
| Gearing Ratio (%) | 38.3% | 39.1% | 38.4% | 37.1% | 37.7% |
| Interest Coverage Ratio (times) | 4.1x | 3.7x | 4.0x | 4.1x | 3.0x |
| Average Cost of Debt (%) | 2.8% | 2.5% | 2.5% | 2.9% | 2.6% |
| FY2017 | FY2018 | FY2019 | FY2020 | ||
| Gearing Ratio (%) | 36.4% | 38.1% | 37.7% | 44.3% | |
| Interest Coverage Ratio (times) | 3.9x | 3.3x | 2.9x | 2.6x | |
| Average Cost of Debt (%) | 2.6% | 2.8% | 3.1% | 2.5% |

My Observations: While its average cost of debt have largely remained consistent over the 9 year period I have looked at, the same cannot be said about its gearing as well as its interest coverage ratio – where the former continuing to edging up over the years while the latter coming down in the same time period.
As far as regulatory limits for the REITs are concerned, in FY2022, for REITs that have an interest coverage of 2.5x and above, its gearing ratio will be at 50.0%. However, for those that have an interest coverage of below 2.5X, its gearing ratio will be at 45.0% – for the case of Suntec REIT, its interest coverage ratio have barely scrapped past the 2.5x for its gearing ratio to be capped at 50.0% – but looking at its gearing ratio recorded in FY2020, at 44.3%, it is on the high end, and this can impact its ability to be able to make further acquisitions, unless it embarks on fund raising activities in a form of private and/or preferential offering – which can result in dilution for existing unitholders.
The REIT’s high gearing ratio (my ideal is for REITs to have at least a 10.0% headroom to the limit), as well as a low interest coverage ratio (in fact this statistic has been on a slide since FY2016) are reasons why I’ve not increased my unitholding in the REIT.
Distribution Per Unit
One thing I like about the REIT is its distribution payout frequency – where the REIT’s management have continued to declare a distribution payout to its unitholders on a quarterly basis (while many of the REITs have changed their payout frequency to semi-annually since FY2020, where they were no longer mandated to publish their full financial statements on a quarterly basis.)
With that, the following table is Suntec REIT’s distribution payout to its unitholders between FY2012 and FY2020:
| FY2012 | FY2013 | FY2014 | FY2015 | FY2016 | |
| Distribution Per Unit (S$’cents) | 9.49 cents | 9.328 cents | 9.40 cents | 10.0 cents | 10.0 cents |
| FY2017 | FY2018 | FY2019 | FY2020 | ||
| Distribution Per Unit (S$’cents) | 10.01 cents | 9.988 cents | 9.507 cents | 7.402 cents |

No doubt the REIT has been payout out a distribution on a quarterly basis, but as you can see from the chart above, it’s payout has been on a decline since FY2018 – something I’m keeping a close watch on in the coming years ahead.
Closing Thoughts
A stable financial performance over the years, along with a resilient portfolio occupancy profile are reasons why I’ve invested in the REIT in the first place, and continuing to remain invested.
No doubt at the time of writing, I’m still sitting at a capital loss of about 15.0% based on its current unit price (at $1.49), but I’m not adding more units to bring down my average price at this point in time due to concerns I have about its debt profile (particularly its high gearing ratio, along with its low interest coverage ratio), and also that its distribution payouts have declined in recent years – that said, I’m confident of the latter recording improvements as the world slowly returning to pre-Covid condition (though at this point in time, the outlook is still murky no thanks to the recently discovered new Omicron variant.)
With that, I have come to the end of my share on Suntec REIT today. Hope you’ve found the contents presented useful and as always, do note that the information you’ve just read about above does not constitute any buy or sell calls for the REIT’s unit. You should always do your own due diligence before you make any investment decisions.
Disclaimer: At the time of writing, I am a unitholder of Suntec REIT.
Are You Worried about Not Having Enough Money for Retirement?
You're not alone. According to the OCBC Financial Wellness Index, only 62% of people in their 20s and 56% of people in their 30s are confident that they will have enough money to retire.
But there is still time to take action. One way to ensure that you have a comfortable retirement is to invest in real estate investment trusts (REITs).
In 'Building Your REIT-irement Portfolio' which I've authored, you will learn everything you need to know to build a successful REIT investment portfolio, including a list of 9 things to look at to determine whether a REIT is worthy of your investment, 1 simple method to help you maximise your returns from your REIT investment, 4 signs of 'red flags' to look out for and what you can do as a shareholder, and more!

You can find out more about the book, and grab your copy (ebook or physical book) here...


Comments (0)