Frasers Centrepoint Trust (SGX:J69U) is a predominantly heartland mall REIT where all but one of its properties are retail malls scattered across the different parts of Singapore (the other property in its portfolio is an office property in Central Plaza located in Tiong Bahru, which was included following the REIT’s acquisition of AsiaRetail Fund Limited in late-October 2020.) The REIT’s 9 retail malls are as follows:
- Causeway Point
- Northpoint City North Wing
- Changi City Point
- Waterway Point
- Tampines 1
- Century Square
- Hougang Mall
- White Sands
- Tiong Bahru Plaza
I’ve added the retail REIT to my long-term investment portfolio back in early-April 2020 when its unit price was trading at $1.85 (which was a 39.3% tumble from its high of $3.05 a month ago) – the huge plunge in the REIT’s unit price was due to the escalating Covid-19 situation in Singapore back then, with the Singapore Government upgrading the DORSCON level to “Orange”, and fears of Singapore following many countries’ footsteps by going into a lockdown to slow down the rate of transmission of the virus (indeed a 2-month ‘circuit breaker’ was implemented between 07 April 2020 and 01 June 2020 where only businesses providing essential services were allowed to operate, while all others had to temporary shutter their physical operations.)
At my investment price of $1.85, the unit price wasn’t the lowest – it continued to fall to $1.54 a few days after before it steadily recovered – for the fact that while the retail industry were adversely affected by the ‘circuit breaker’ measures, but as a majority of the population were working from home, they continued to visit the retail mall for daily necessities (like food, groceries, and medication.)
Throughout this period, I continued to stay invested in the REIT for I know that its business fundamentals (which I will talk about soon in the rest of this post) remains intact, and I’m confident of its unit price recovering as soon as the Covid situation improves – and looking at the REIT’s unit price at the time of writing, I’m currently sitting on an unrealised capital gain of 17.4% (again not bad for a return on investment for a 1.5 year period.)
In the rest of this post, you’ll learn about reasons why I’ve made the investment decision on the REIT in terms of its financial performance, portfolio occupancy, debt profile, and distribution payouts to unit holders over the past 10 years (between FY2011/12 and FY2020/21 – the REIT has a financial year end every 30 September), along with my outlook for the REIT in the coming financial year ahead.
Let’s begin…
Financial Performance
The following is the retail REIT’s key financial performance over a period of 10 years – between FY2011/12 and FY2020/21:
| FY 2011/12 | FY 2012/13 | FY 2013/14 | FY 2014/15 | FY 2015/16 | |
| Gross Revenue (S$’mil) | $147.2m | $158.0m | $168.8m | $189.2m | $183.8m |
| Net Property Income (S$’mil) | $104.4m | $111.6m | $118.1m | $131.0m | $129.9m |
| Distributable Income to Unitholders (S$’mil) | $82.3m | $90.1m | $95.4m | $106.4m | $108.1m |
| FY 2016/17 | FY 2017/18 | FY 2018/19 | FY 2019/20 | FY 2020/21 | |
| Gross Revenue (S$’mil) | $181.6m | $193.3m | $196.4m | $164.4m | $341.1m |
| Net Property Income (S$’mil) | $129.6m | $137.2m | $139.3m | $110.9m | $246.6m |
| Distributable Income to Unitholders (S$’mil) | $109.8m | $111.3m | $119.7m | $101.1m | $204.7m |

Gross revenue and net property income for the REIT saw year-on-year (y-o-y) declines in 3 out of 10 years I have looked at – in FY2015/16 (due to lower revenue contribution from Northpoint and Changi City Point as a result of asset enhancement initiative works in the former, and changeover in an anchor tenant in the latter), FY2016/17 (due to loss of revenue from planned vacancies at Northpoint City North Wing in conjunction with its ongoing asset enhancement works), as well as in FY2019/20 (due to rental rebates assistance granted to tenants affected by the Covid-19 pandemic.) Also, the huge increase in its gross revenue and net property income in the latest financial year 2020/21 was due to contribution from the newly added properties from AsiaRetail Fund Limited’s portfolio following the completion of the acquisition. In terms of its compound annual growth rate (CAGR) over a 10-year period, both of them were at 9% – pretty impressive in my opinion.
However, the REIT’s distributable income to its unitholders saw y-o-y increases every single financial year (except for in FY2019/20, due to rental rebates provided to its tenants to help them tide through headwinds posed by the pandemic.) Over a 10-year period, its distributable income to unitholders grew at a CAGR of 10%.
All in all, the REIT’s ability to record a stable growth in its financial performance is one of the reasons why I’ve made the investment decision on it.
Portfolio Occupancy
When studying a REIT’s portfolio occupancy profile, my preference is towards those that are able to maintain a high occupancy rate (above 90.0%), and that it is able to maintain a positive rental reversion (from new as well as expiring leases) over a period of at least 3-5 years.
Let’s see if the REIT’s portfolio occupancy profile recorded over the past 10 years were able to fulfil the above 2 requirements of mine:
| FY 2011/12 | FY 2012/13 | FY 2013/14 | FY 2014/15 | FY 2015/16 | |
| Portfolio Occupancy (%) | 93.6% | 98.4% | 98.9% | 96.0% | 89.4% |
| Rental Reversion (%) | +12.1% | +7.7% | +6.5% | +6.3% | +9.9% |
| FY 2016/17 | FY 2017/18 | FY 2018/19 | FY 2019/20 | FY 2020/21 | |
| Portfolio Occupancy (%) | 92.0% | 94.7% | 96.5% | 94.9% | 97.3% |
| Rental Reversion (%) | +5.5% | +3.2% | +4.8% | +4.2% | -0.6% |
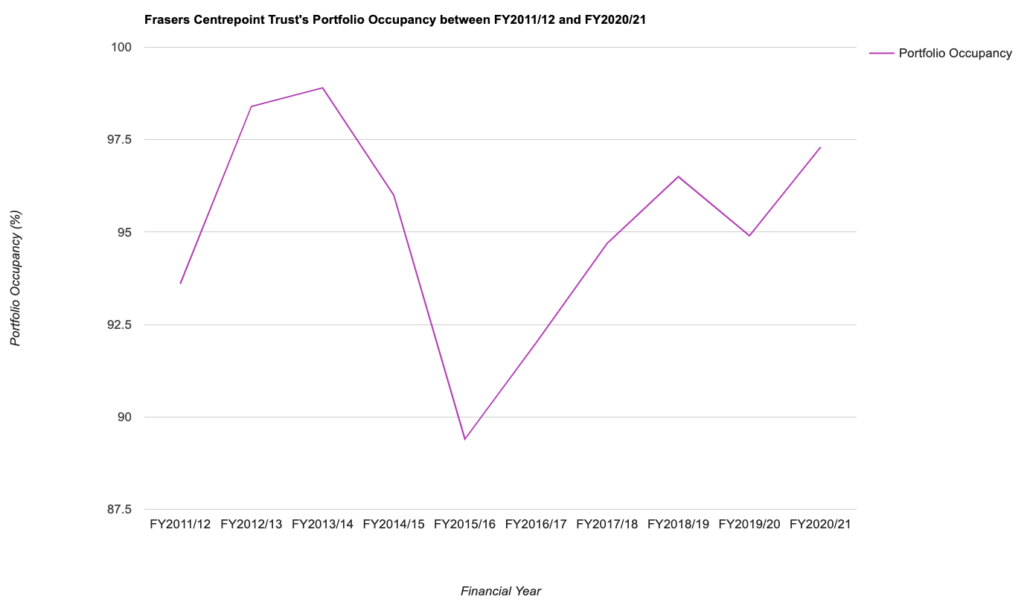
My Observations: I must say in terms of portfolio occupancy of the REIT’s malls, it has remained resilient throughout the years in that it has kept its occupancy rate at above 90.0% in all but one year (in FY2015/16, mainly due to asset enhancement initiative works in Northpoint, along with transitional vacancy at Changi City Point.)
Additionally, the REIT have also managed to record a positive rental reversion in all but the latest financial year 2020/21 – due to headwinds relating to the ongoing Covid-19 pandemic, and as a result, rental rates for the malls were made attractive in an effort to retain existing tenants (and keep the occupancy rate high.)
If there’s a slight negative as far as the REIT’s portfolio occupancy profile is concerned, it will be its steadily declining rental reversion recorded over the years.
Debt Profile
When it comes to reviewing a REIT’s debt profile, my focus is on its aggregate leverage (or gearing ratio, as some REITs would like to call it), along with its interest coverage ratio – where my preference is towards REITs with an aggregate leverage having a 10% headroom to the regulatory limit (from 2022, REITs that have a interest coverage of at least 2.5x will have its aggregate leverage capped at 50.0%, while those that do not will have its aggregate leverage capped at 45.0%), along with its interest coverage of at least 5x.
So, did Frasers Centrepoint Trust’s debt profile over the years fulfil my investment criteria? Let us take a look at it in the table below:
| FY 2011/12 | FY 2012/13 | FY 2013/14 | FY 2014/15 | FY 2015/16 | |
| Aggregate Leverage (%) | 30.1% | 27.6% | 29.4% | 28.2% | 28.3% |
| Interest Coverage Ratio (times) | 5.6x | 6.2x | 6.2x | 6.6x | 7.4x |
| Average Term to Debt Maturity (years) | 3.1 years | 2.9 years | 2.5 years | 1.6 years | 2.7 years |
| Average Cost of Debt (%) | 2.7% | 2.7% | 2.5% | 2.4% | 2.1% |
| FY 2016/17 | FY 2017/18 | FY 2018/19 | FY 2019/20 | FY 2020/21 | |
| Aggregate Leverage (%) | 29.0% | 28.6% | 32.9% | 35.9% | 33.3% |
| Interest Coverage Ratio (times) | 6.9x | 6.3x | 4.5x | 5.0x | 5.1x |
| Average Term to Debt Maturity (years) | 2.3 years | 2.0 years | 2.3 years | 2.1 years | 2.5 years |
| Average Cost of Debt (%) | 2.3% | 2.6% | 2.6% | 2.4% | 2.2% |
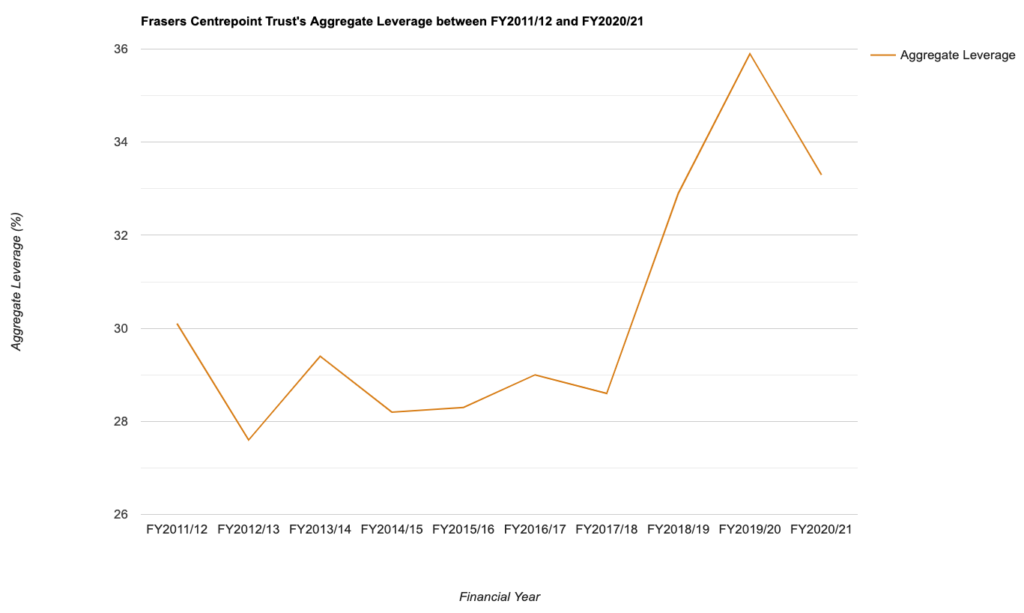
My Observations: Over the years, the REIT has managed to maintain its aggregate leverage at below 35% (except for in FY2019/20 where it went a little bit over) – whether you base the cap for the aggregate leverage at 45.0% or 50.0%, there remains plenty of debt headroom for it to embark on yield-accretive acquisitions to further improve returns to unitholders as an when an opportunity to do so comes along – and this is something I like.
The same can also be said for its interest coverage ratio – where it has been maintained at 5x in all but one year (in FY2018/19).
Finally, in terms of its average term to debt maturity as well as its average cost of debt, it has remained pretty stable over the years.
All in all, the REIT’s debt profile is one I find comfortable with (and it also ticks all the boxes as far as my requirements about a REIT’s debt profile are concerned), and its another reason for me making the investment decision on it.
Distribution Payout to Unitholders
Prior to FY2020/21, the management of Frasers Centrepoint Trust have been declaring a distribution payout to its unitholders on a quarterly basis (which is one of the reasons why I’ve invested in the REIT as my preference is towards those that are able to pay out a distribution every 3 months.)
However, as companies are only required to release their full financial reports on a half-yearly basis (instead of on a quarterly basis) from the calendar year 2020, the REIT have also switched to paying out a distribution to its unitholders in the same frequency starting from the financial year 2020/21 onwards.
With that, let us take a look at the distribution payouts which the REIT have made to its unitholders over the past 9 years (between FY2011/12 and FY2020/21):
| FY 2011/12 | FY 2012/13 | FY 2013/14 | FY 2014/15 | FY 2015/16 | |
| Distribution Per Unit (S$’cents) | 10.01 cents | 10.93 cents | 11.19 cents | 11.61 cents | 11.76 cents |
| FY 2016/17 | FY 2017/18 | FY 2018/19 | FY 2019/20 | FY 2020/21 | |
| Distribution Per Unit (S$’cents) | 11.90 cents | 12.02 cents | 12.07 cents | 9.174 cents | 11.953 cents |
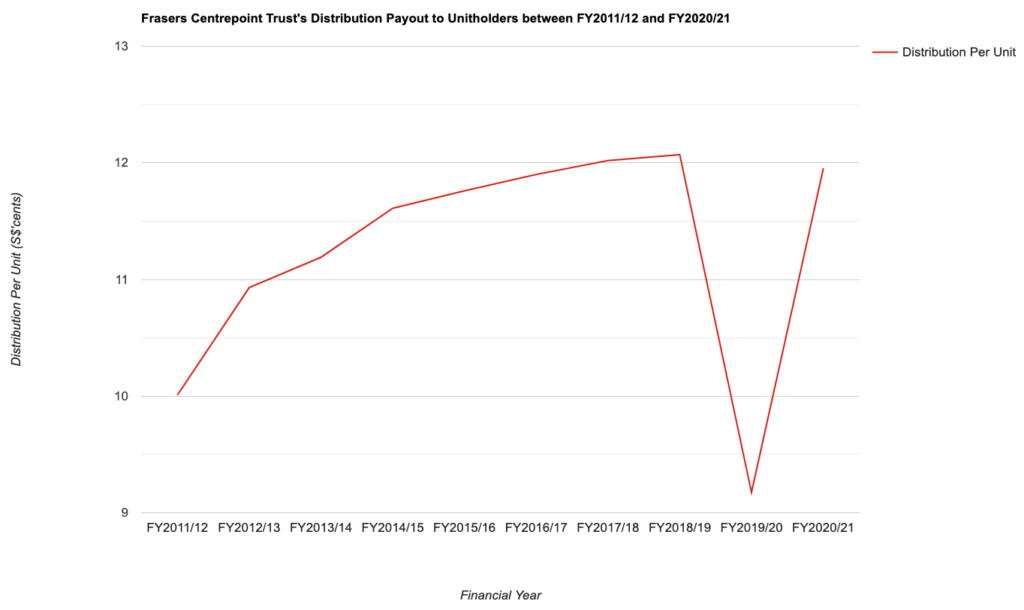
The only year which the REIT’s distribution payouts saw a y-o-y decline was in FY2019/20 (due to rental rebates provided to the REIT’s tenants whose businesses were negatively impacted by the Covid-19 pandemic.)
Apart from that, in the remaining 9 years, unitholders were rewarded for the REIT’s resilient performance in higher payouts. In terms of its CAGR, it was at 2% a period of 10 years.
Closing Thoughts
A consistently growing financial performance, resilient portfolio occupancy and debt profile, along with a rising distribution payout to unitholders over the last 10 financial years are reasons why I’ve invested in the retail REIT (and continuing to remain invested in it.)
Looking ahead, my opinion is that as the REIT’s retail malls are all located in heartland locations, they will continue to remain resilient as regardless whether or not there is a pandemic, people staying in the vicinity of the malls will continue to visit it to fulfil their daily needs and window shop (as heartland malls these days have more or less the same branded shops you will find in CBD malls.) As such, I am confident in the REIT continuing to report resilient results in the year ahead (unless the new Omicron variant situation were to worsen to the extent where the Singapore government will have to implement another round of ‘circuit breaker’ to slowdown the chain of transmission to prevent our healthcare resources from becoming overloaded – which at this point in time I think is very unlikely.)
With that, I have come to the end of my review of Frasers Centrepoint Trust’s results over the years. Please note that everything you’ve just read in this post are purely for informational purposes only, and that they do not represent any buy or sell calls for the REIT’s units. You’re strongly encouraged to do your own due diligence before making any investment decisions.
Disclaimer: At the time of writing, I am a unitholder of Frasers Centrepoint Trust.
Are You Worried about Not Having Enough Money for Retirement?
You're not alone. According to the OCBC Financial Wellness Index, only 62% of people in their 20s and 56% of people in their 30s are confident that they will have enough money to retire.
But there is still time to take action. One way to ensure that you have a comfortable retirement is to invest in real estate investment trusts (REITs).
In 'Building Your REIT-irement Portfolio' which I've authored, you will learn everything you need to know to build a successful REIT investment portfolio, including a list of 9 things to look at to determine whether a REIT is worthy of your investment, 1 simple method to help you maximise your returns from your REIT investment, 4 signs of 'red flags' to look out for and what you can do as a shareholder, and more!

You can find out more about the book, and grab your copy (ebook or physical book) here...


Comments (0)