Listed on the SGX since 28 July 2005 with 15 properties in Singapore and a portfolio value of S$422.0m, today, Mapletree Logistics Trust (SGX:M44U) has a total of 163 properties in Singapore, Hong Kong, China, Japan, Australia, South Korea, Malaysia, Vietnam, and India, and a portfolio value of S$10.8 billion (as at the end of the second quarter of FY2021/22 ended 30 September 2021.) The logistics REIT has also been included as one of the constituents of the Straits Times Index since 23 December 2019 (you can read the announcement in full on SGX’s website here.)
The blue-chip logistics REIT is one of my more recent additions at $1.98 back in October 2020 (where, based on this unit price, along with its distribution per unit of 8.142 cents/unit in FY2019/20, the yield was at 4.1% – which satisfied my requirement of a yield of at least 4.0%.) After averaging down once in March (at a price of $1.80), and also subscribing to the its preferential offering recently (you can read the news report on the Business Times in full here), my average price for the REIT is now at $1.89 – if I were to re-calculate my yield percentage based on the total distribution per unit of 8.142 cents/unit, my yield is now increased to 4.3%.
So, why did I invest in the REIT in the first place, and why am I staying invested in the REIT despite its unit price being battered recently? Allow me to explain this by sharing with you its financial performances, portfolio occupancy and debt profile, along with its distribution payout to its unitholders over the past 10 years (between FY2012/13 and FY2020/21 – the REIT has a financial year end every 31 March), along with my personal views about its recent unit price movement, and finally, outlook for the REIT ahead.
Let’s begin:
Financial Performance
When it comes to deciding whether or not to invest in a company – one of the very first things I look at is the company’s financial performance, where it has to show a gradual improvement in terms of its top- and bottom-line over a period of at least 3-5 years.
With that, let us take a look at some of the REIT’s key financial performances recorded between FY2012/13 and FY2020/21 – a period of 9 financial years:
| FY 2012/13 | FY 2013/14 | FY 2014/15 | FY 2015/16 | FY 2016/17 | |
| Gross Revenue (S$’mil) | $307.8m | $310.7m | $330.1m | $349.9m | $373.1m |
| Net Property Income (S$’mil) | $268.1m | $267.6m | $277.4m | $290.9m | $312.2m |
| Distributable Income to Unitholders (S$’mil) | $166.4m | $179.7m | $184.9m | $183.3m | $186.1m |
| FY 2017/18 | FY 2018/19 | FY 2019/20 | FY 2020/21 | ||
| Gross Revenue (S$’mil) | $395.2m | $454.3m | $490.8m | $561.1m | |
| Net Property Income (S$’mil) | $333.8m | $389.5m | $438.5m | $499.1m | |
| Distributable Income to Unitholders (S$’mil) | $212.9m | $270.0m | $301.7m | $333.1m |
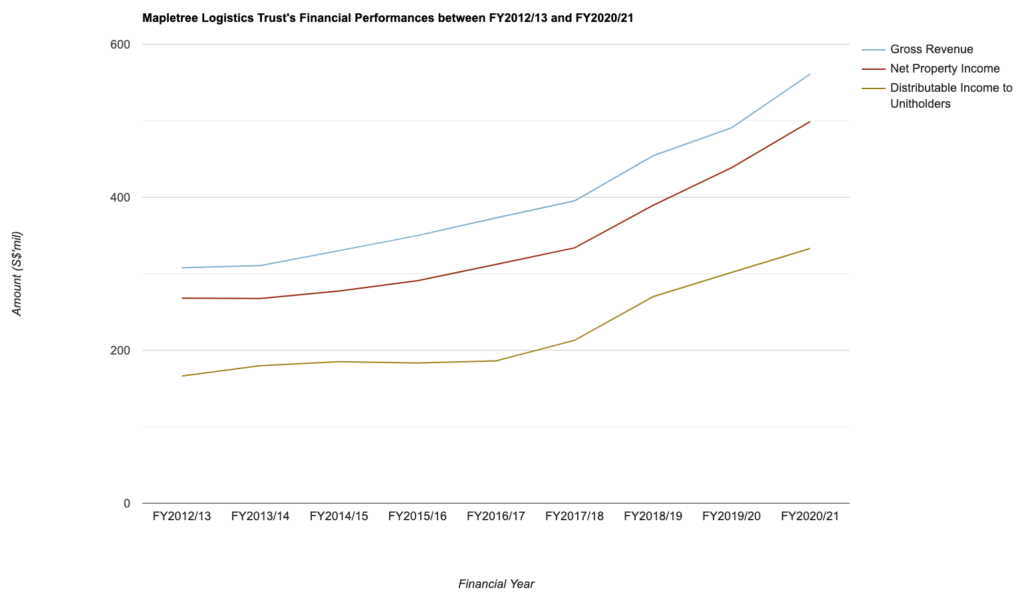
As far as the REIT’s results over the past 9 financial years is concerned, it has been on an upward moving trend:
It’s gross revenue saw year-on-year (y-o-y) improvements over the last 9 years, recording a compound annual growth rate (CAGR) of 7%.
Meanwhile, its net property income as well as its distributable income to unitholders fell in just one out of the 9 financial years that I’ve looked at – with the former growing at a CAGR of 7% and the latter at 8%.
Portfolio Occupancy
If the company I’m studying is a REIT, then one of the things I’ll look at is its portfolio occupancy profile – where my requirement is that the overall portfolio occupancy have to be at a high rate (of at least 90.0%), and at the same time, the REIT must also display its ability to maintain, or even better, record improvements in its portfolio occupancy over the years.
So, did Mapletree Logistics Trust’s portfolio occupancy over the last 9 years fulfil this criteria of mine? Let us have a look below:
| FY 2012/13 | FY 2013/14 | FY 2014/15 | FY 2015/16 | FY 2016/17 | |
| Portfolio Occupancy (%) | 98.5% | 98.3% | 96.7% | 96.2% | 96.3% |
| Portfolio WALE (by NLA – Years) | 5.3 years | 4.8 years | 4.3 years | 4.5 years | 4.0 years |
| FY 2017/18 | FY 2018/19 | FY 2019/20 | FY 2020/21 | ||
| Portfolio Occupancy (%) | 96.6% | 98.0% | 98.0% | 97.5% | |
| Portfolio WALE (by NLA – Years) | 3.5 years | 3.8 years | 4.3 years | 3.6 years |
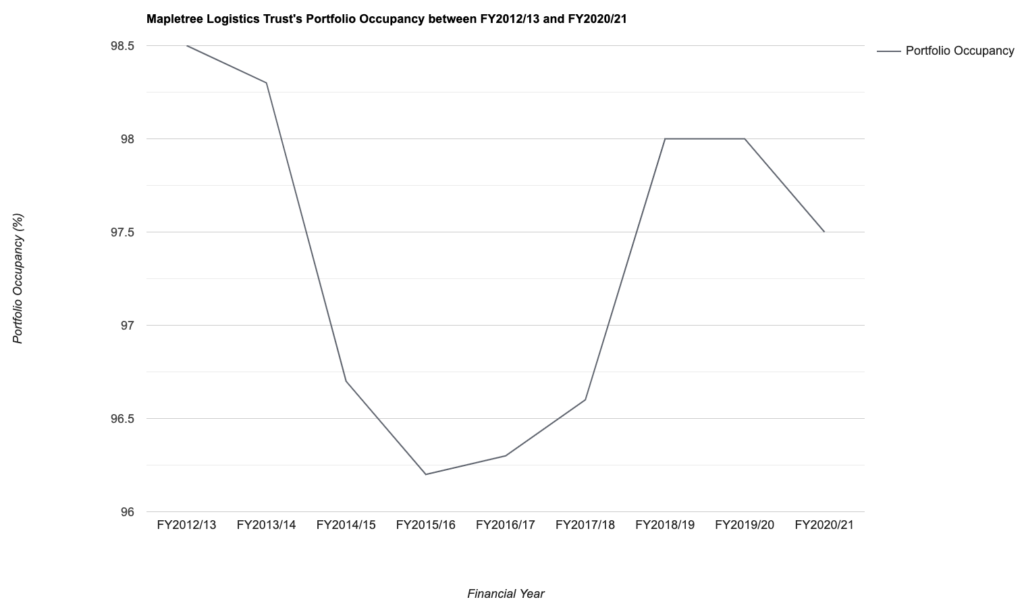
My Observations: Even though the REIT’s overall portfolio occupancy saw a downward decline between FY2012/12 and FY2015/16 – where it fell from a high of 98.5% (the highest in 9 years) to a low of just 96.2% (the lowest in 9 years), it recovered in the subsequent years.
Its portfolio weighted average lease expiry (WALE) also saw a similar trend – where it declined in the same time period where its portfolio occupancy declined, before recovering thereafter, along with improvements in its occupancy rate.
No doubt the REIT’s occupancy profile saw declines in some years, it still meets my requirement of having maintained an overall portfolio occupancy rate of at least 90.0% over the past 9 years I have looked at.
Debt Profile
When it comes to reviewing a REIT’s debt profile, my requirement is that its aggregate leverage (or gearing ratio as some REITs would like to call it) has to maintain a debt headroom of at least 10.0% before it reaches the regulatory limit (and as far as this ratio is concerned, from 2022, REITs that are able to maintain an interest coverage ratio of at least 2.5x will have their aggregate leverage capped at 50.0%, while those that are not able to will have their aggregate leverage capped at 45.0%.)
Also, my preference is in REITs that have a stable average cost of debt over the years.
With that, let us take a look at the REIT’s debt profile recorded over the last 10 financial years:
| FY 2012/13 | FY 2013/14 | FY 2014/15 | FY 2015/16 | FY 2016/17 | |
| Aggregate Leverage (%) | 34.1% | 33.3% | 34.3% | 39.6% | 38.5% |
| Interest Coverage Ratio (times) | 6.6x | 8.7x | 7.5x | 5.9x | 5.6x |
| Average Term to Debt Maturity (years) | 3.9 years | 3.6 years | 3.6 years | 3.5 years | 3.9 years |
| Average Cost of Debt (%) | 2.4% | 1.9% | 2.1% | 2.3% | 2.3% |
| FY 2017/18 | FY 2018/19 | FY 2019/20 | FY 2020/21 | ||
| Aggregate Leverage (%) | 37.7% | 37.7% | 39.3% | 38.4% | |
| Interest Coverage Ratio (times) | 5.6x | 4.9x | 4.9x | 5.1x | |
| Average Term to Debt Maturity (years) | 4.5 years | 4.1 years | 4.1 years | 3.8 years | |
| Average Cost of Debt (%) | 2.4% | 2.7% | 2.5% | 2.2% |

My Observations: No doubt its aggregate leverage have went up steadily from a low of 33.3% in 2013/14 (which coincidentally is the lowest in the 9 years I have looked at) to a high of 39.3% in FY2019/20 (the highest in 9-years), but it has stabilised in the years thereafter. Also, looking at the aggregate leverage recorded in the latest financial year 2020/21, there still remains more than 10.0% of debt headroom before the regulatory limit of 50.0% (as the REIT has maintained its interest coverage at above 2.5x) is reached – which passes my criteria for selection.
Also, its average of debt have also remained stable over the years – where it hoovered at between 2.1% and 2.5% over the last 9 years.
Distribution Payout to Unitholders
Mapletree Logistics Trust is one of the few REITs that have continued to not only report its full financial statements on a quarterly basis (despite Singapore-listed companies are no longer mandated to do so from 2020), its management have continued to declare a distribution payout to its unitholders in the same time frequency (it’s also one of the reasons why I’ve invested in the REITs.)
In the table below, you’ll find the REIT’s distribution payout to its unitholders over the last 9 financial years:
| FY 2012/13 | FY 2013/14 | FY 2014/15 | FY 2015/16 | FY 2016/17 | |
| Distribution Per Unit (S$’cents) | 6.86 cents | 7.35 cents | 7.50 cents | 7.38 cents | 7.44 cents |
| FY 2017/18 | FY 2018/19 | FY 2019/20 | FY 2020/21 | ||
| Distribution Per Unit (S$’cents) | 7.618 cents | 7.941 cents | 8.142 cents | 8.326 cents |
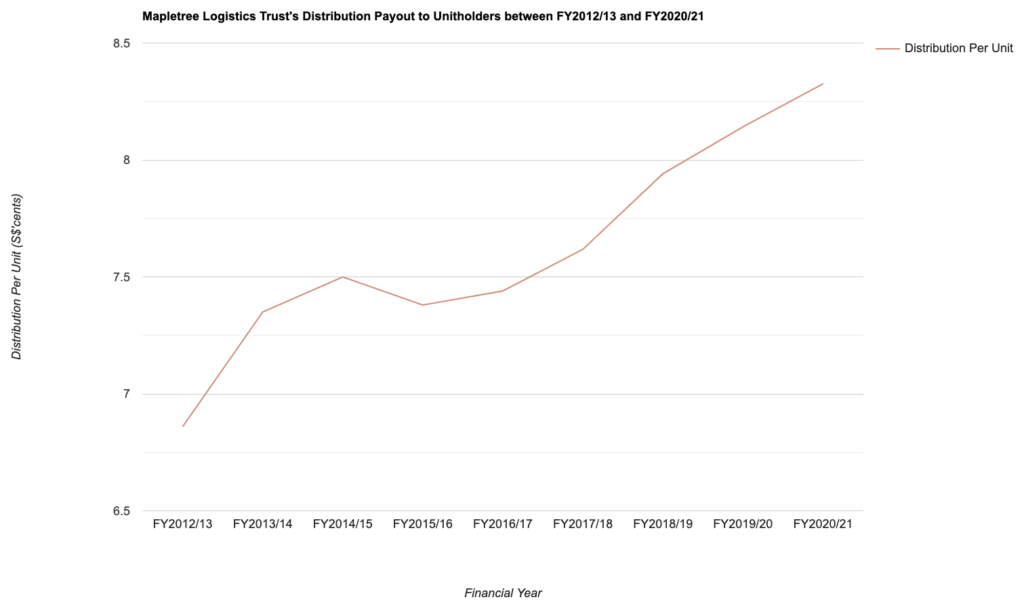
As far distribution payouts by the REIT is concerned, it has been on a steady upward moving trend every single year over the past 9 years (apart from FY2015/16 where it fell slightly due to a larger issue units base) – from 6.86 cents/unit in FY2012/13 to a high of 8.326 cents/unit – a CAGR of 2%.
Closing Thoughts
A steadily improving financial performance reported by the REIT, resilient portfolio occupancy and a conservative debt profile over the years, along with improvements in its distribution payout every single year over the past 9 financial years I have looked at are reasons why I have invested in the REIT (and remain invested till this very day.)
I understand that some of you may be concerned about the REIT’s recent share price movements – In my personal opinion, it is very likely due to investors (both retail as well as institutional) shifting their monies from the safer haven REITs into companies that will benefit from the gradual economic recovery (such as those in the aviation, hospitality, as well as in the tourism and leisure sectors.) The business fundamentals for the REIT continues to remain sound. As such, should the price of the REIT were to fall further in the coming days or weeks ahead, I’ll be looking to buy more units to bring down my average price for the REIT (and in so doing, further bringing up my yield.)
Finally, on my thoughts about the REIT’s performances ahead, it is a bright one – where demand for logistics space will continue to grow with the proliferation of e-commerce. Also, I noted that the REIT have been actively seeking out acquisition opportunities from the Sponsor as well as from third-parties to further deepen their presence in both developed as well as developing countries (just in the year 2021 alone, the REIT have announced the acquisition of 5 modern logistics facilities in South Korea in February, 2 modern logistics properties in India in March, 1 logistics property in Singapore (9 Changi South Street 2) in July, a cold storage facility in Melbourne, Australia, in August 2021, a modern logistics facility in South Korea in October, and 13 China, 3 Vietnam, and 1 Japan logistics property in November) – such activities should see its financial performances, along with its distribution payout to unitholders improving in the years ahead.
With that, I have come to the end of my review on Mapletree Logistics Trust’s performances over the past 9 years, along with my outlook for it in the years ahead. I hope you’ve found the contents presented above useful and finally, please note that everything you’ve just read above is purely for educational purposes only, and they do not represent any buy or sell recommendation for the REIT’s units. As always, you are strongly advised to do your own due diligence before making any investment decisions.
Disclaimer: At the time of writing, I am a unitholder of Mapletree Logistics Trust.
Are You Worried about Not Having Enough Money for Retirement?
You're not alone. According to the OCBC Financial Wellness Index, only 62% of people in their 20s and 56% of people in their 30s are confident that they will have enough money to retire.
But there is still time to take action. One way to ensure that you have a comfortable retirement is to invest in real estate investment trusts (REITs).
In 'Building Your REIT-irement Portfolio' which I've authored, you will learn everything you need to know to build a successful REIT investment portfolio, including a list of 9 things to look at to determine whether a REIT is worthy of your investment, 1 simple method to help you maximise your returns from your REIT investment, 4 signs of 'red flags' to look out for and what you can do as a shareholder, and more!

You can find out more about the book, and grab your copy (ebook or physical book) here...


Comments (0)