The Estée Lauder Companies Inc. (NYSE:EL) another one which probably do not require further introduction – the company is one of the world’s leading manufacturers, marketers, and sellers of quality skin care, makeup, fragrance, and hair care products, where they are sold in 150 countries around the world.

Apart from its namesake brand of skin care products, the brand ‘Origins’ is also by the NYSE-listed company – Photo by Michela Ampolo on Unsplash
Some of the brand names include (I am perfectly sure you have heard about most of them before):
- Estée Lauder
- Clinique
- Origins
- M.A.C
- Bobbi Brown
- La Mer
- Aveda
- Jo Malone London
- Too Faced
- Dr Jart+
- The Ordinary
That said, is the NYSE-listed company a ‘buy’?
To best answer this question, let us take a look at its financial performance, debt profile, along with its dividend payout over the last 8 years (I will be looking at the period between FY2014/15 and FY2021/22 – it has a financial year end every 30 June), as well as for the first 9 months of the current financial year 2022/23, along with whether at its current traded price, it is considered ‘cheap’ or ‘expensive’ based on its current valuations vs. its 8-year average.
Let’s begin:
Financial Performance
In this section about the NYSE-listed company’s financial performance, I will be looking at its total revenue and net profit, gross and net profit margin, as well as its return on equity recorded over the last 8 years, as follows:
Total Revenue & Net Profit (US$’mil):
| FY 2014/15 | FY 2015/16 | FY 2016/17 | FY 2017/18 | |
| Total Revenue (US$’mil) | $10,780m | $11,262m | $11,824m | $13,683m |
| Net Profit (US$’mil) | $1,094m | $1,115m | $1,256m | $1,108m |
| FY 2018/19 | FY 2019/20 | FY 2020/21 | FY 2021/22 | |
| Total Revenue (US$’mil) | $14,863m | $14,294m | $16,215m | $17,737m |
| Net Profit (US$’mil) | $1,785m | $684m | $2,870m | $2,390m |

My Observations: Total revenue fell in 1 out of the 8 years I have looked at (in FY2019/20, due to global store closures as a result of lockdowns implemented by Governments around the world due to Covid-19 pandemic), and manage to grow at a compound annual growth rate (CAGR) of 6.4% – which in my opinion is pretty decent.
Net profit fell in 3 out of 8 years – in FY2017/18 and the latest full year in FY2021/22, it was due to restructuring and other charges and adjustments; in FY2019/20, it was due to Covid-19 lockdowns. Despite of that, in terms of its CAGR, it still manage to record an impressive 10.3% over the last 8 years.
Gross & Net Profit Margins (%):
The following table is the NYSE-listed company’s gross and net profit margins I have computed:
| FY 2014/15 | FY 2015/16 | FY 2016/17 | FY 2017/18 | |
| Gross Profit Margin (%) | 80.5% | 80.6% | 79.4% | 79.2% |
| Net Profit Margin (%) | 10.1% | 9.9% | 10.6% | 8.1% |
| FY 2018/19 | FY 2019/20 | FY 2020/21 | FY 2021/22 | |
| Gross Profit Margin (%) | 77.2% | 75.2% | 76.4% | 75.7% |
| Net Profit Margin (%) | 12.0% | 4.8% | 17.7% | 13.5% |
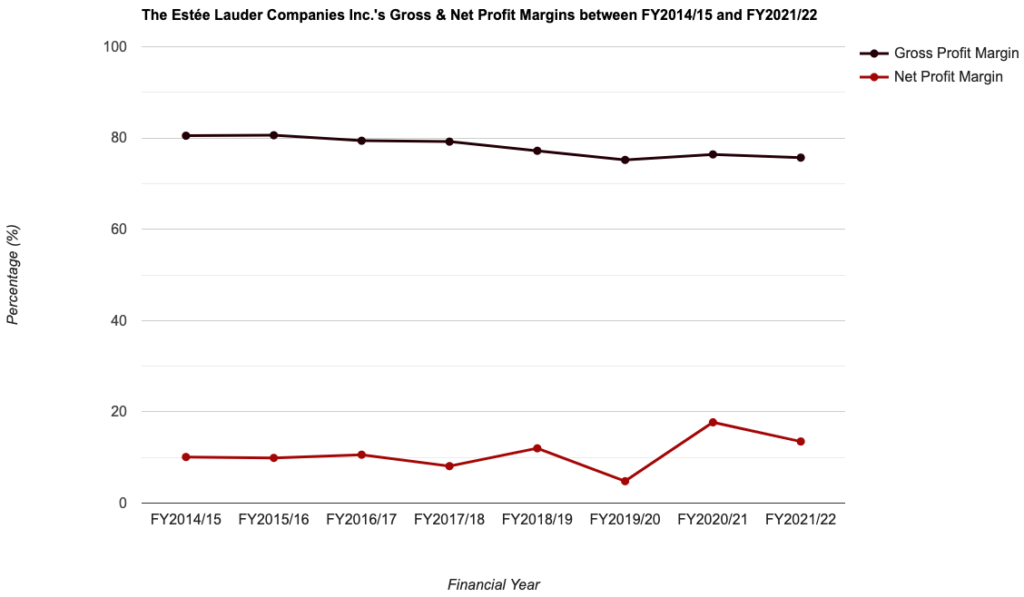
My Observations: Gross profit margin have largely hoovered at around the 70+% range in most years, which is considered very healthy in my opinion.
However, its net profit margin have fluctuated over the years, as a result of the net profit recording year-on-year (y-o-y) declines in 3 out of 8 years.
Return on Equity (%):
Return on Equity, or RoE for short, is the computation of the percentage of profits a company generates for every dollar of shareholders’ money it uses in its businesses. Personally, I would like a company to maintain this financial ratio at above 15.0% over the years.
With that, let us take a look at The Estée Lauder Companies Inc.’s RoE over the last 8 years which I have computed:
| FY 2014/15 | FY 2015/16 | FY 2016/17 | FY 2017/18 | |
| Return on Equity (%) | 30.0% | 31.2% | 28.6% | 23.6% |
| FY 2018/19 | FY 2019/20 | FY 2020/21 | FY 2021/22 | |
| Return on Equity (%) | 40.7% | 17.4% | 47.1% | 42.8% |
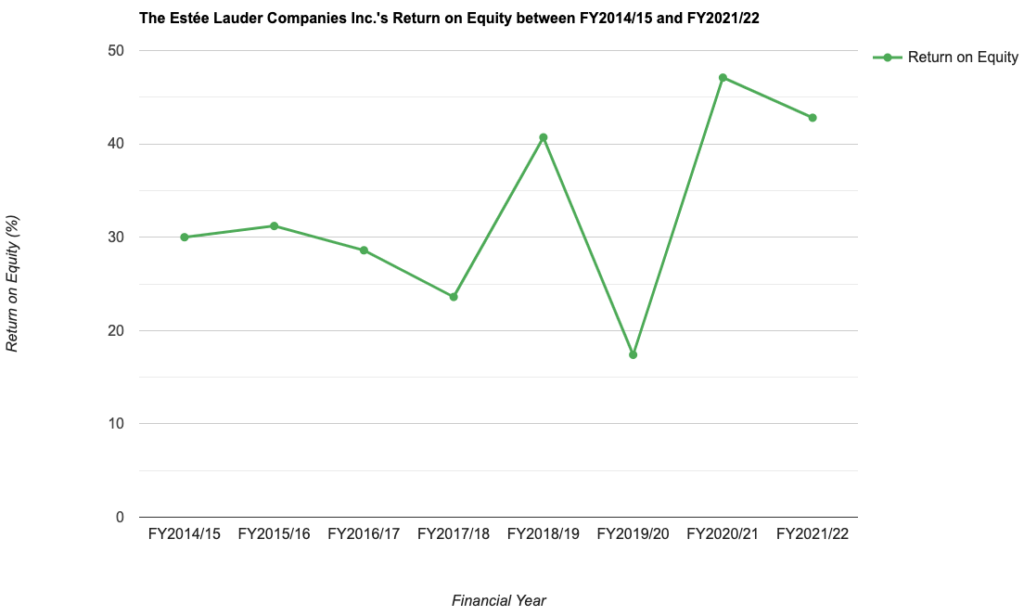
My Observations: While its RoE have also fluctuated over the years, but it has been maintained at above 15.0% throughout – which meets my criteria for selection.
Debt Profile
Besides its financial performance, another thing I look at when I study about a company is its debt profile, where my preference is towards those with minimal or no debt.
In the table below, you’ll find The Estée Lauder Companies Inc.’s debt profile over the last 8 financial years:
| FY 2014/15 | FY 2015/16 | FY 2016/17 | FY 2017/18 | |
| Cash & Cash Equivalents (US$’mil) | $1,021m | $914m | $1,136m | $2,181m |
| Total Borrowings (US$’mil) | $1,625m | $2,242m | $3,572m | $3,544m |
| Net Cash/ Debt (US$’mil) | -$604m | -$1,328m | -$2,436m | -$1,363m |
| Current Ratio | 2.0 | 1.6 | 1.8 | 1.9 |
| FY 2018/19 | FY 2019/20 | FY 2020/21 | FY 2021/22 | |
| Cash & Cash Equivalents (US$’mil) | $2,987m | $5,022m | $4,958m | $3,957m |
| Total Borrowings (US$’mil) | $3,412m | $6,136m | $5,569m | $5,412m |
| Net Cash/ Debt (US$’mil) | -$425m | -$1,114m | -$611m | -$1,455m |
| Current Ratio | 1.6 | 1.7 | 1.8 | 1.6 |

My Observations: While the company is in a net debt position in all the 8 financial years I have looked at, its current ratio is maintained at about 1.0 throughout the years – suggesting it is more than able to fulfil any short-term debt obligations.
Dividend Payouts to Shareholders
The Estée Lauder Companies Inc.’s management declares a dividend payout to its shareholders on a quarterly basis – however, do take note that if you are a Singaporean investing in US-listed companies, all dividend payouts declared are subject to a 30.0% withholding tax, meaning the amount you eventually receive will be 30.0% less.
With that, let us take a look at the dividend payouts by the NYSE-listed company over the last 8 years:
| FY 2014/15 | FY 2015/16 | FY 2016/17 | FY 2017/18 | |
| Dividend Per Share (US$/share) | $0.92 | $1.14 | $1.32 | $1.48 |
| FY 2018/19 | FY 2019/20 | FY 2020/21 | FY 2021/22 | |
| Dividend Per Share (US$/share) | $1.67 | $1.39 | $2.07 | $2.33 |
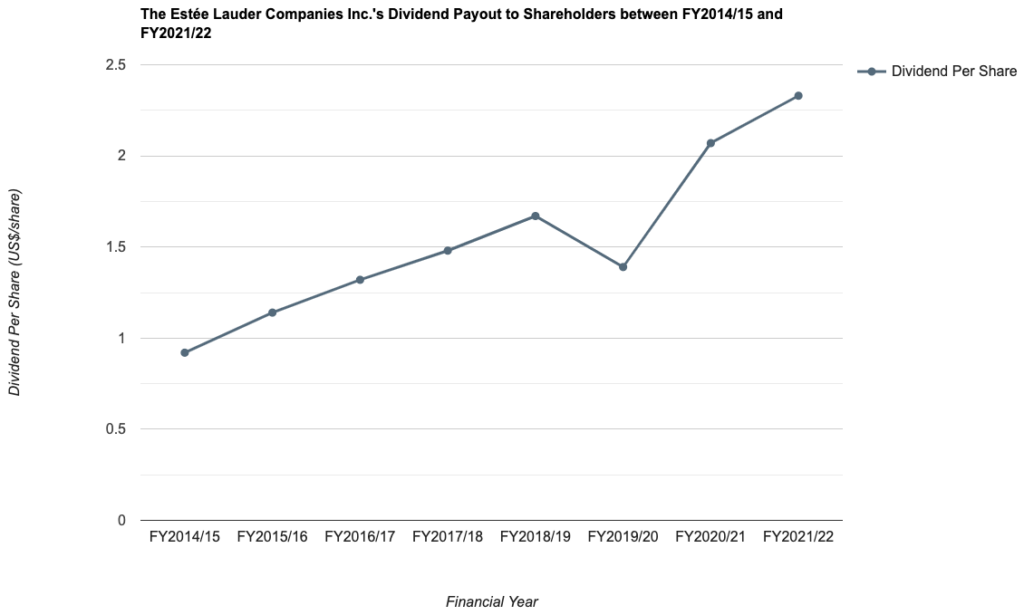
My Observations: Despite fluctuations in its net profit over the years, its dividend payout have been quite consistent, where it increased every year except for FY2019/20 (due to the pandemic).
Over the last 8 years, the company’s dividend payout have grown at a CAGR of 12.3%, pretty much in line with the CAGR of its net profit in the same time period.
Year-to-Date Performance (9M FY2021/22 vs. 9M FY2022/23)
The following table is Estée Lauder’s performance for the first 9 months of the current financial year 2022/23, compared to that recorded in the same time period last year:
| 9M FY2021/22 | 9M FY2022/23 | % Variance | |
| Total Revenue (US$’mil) | $14,176m | $12,301m | -13.2% |
| Net Profit (US$’mil) | $2,338m | $1,039m | -55.6% |
| Gross Profit Margin (%) | 76.9% | 72.4% | -4.5pp |
| Net Profit Margin (%) | 16.5% | 8.4% | -8.1pp |
| Cash & Cash Equivalent (US$’mil) | $3,836m | $5,531m | +44.2% |
| Total Borrowings (US$’mil) | $5,457m | $7,371m | +35.1% |
| Net Cash/Debt (US$’mil) | -$1,621m | -$1,840m | N.M. |
| Dividend Per Share (US$/share) | $1.73 | $1.92 | +11.0% |
My Observations: On the whole, the first 9 months of the current financial year under review has been a weaker one for the NYSE-listed company.
Its total revenue and net profit suffering from double digit parentage declines (the 13.2% fall in its total revenue was due to a decline in organic sales, along with negative impact from currency exchange, while the 55.6% plunge in its net profit was mainly due to impacts of intangible asset impairments, restructuring and other charges and adjustments, along with a huge jump in effective tax rate due to the expected change in the company’s geographical earnings for the current financial year under review.)
In terms of its debt profile, it also fell deeper into a net debt position, at -$1,840m, compared to the same time period last year.
The only bright spark was the 11.0% increase in its dividend payout to its shareholders (to US$1.92) compared to last year.
Is the Current Traded Price of The Estée Lauder Companies Inc. Considered ‘Cheap’ or ‘Expensive’?
Based on its current traded price of US$198.00 as at market close on 03 July 2023, its current valuations, compared to its 8-year average, is as follows:
| Current | 8-Year Average | |
| P/E Ratio | 51.7 | 44.7 |
| P/B Ratio | 11.7 | 13.1 |
| Dividend Yield | 1.2%^^ | 1.0% |
My Observations: At its current traded price, The Estée Lauder Companies Inc. is considered ‘cheap’ due to its current P/B ratio lower than its 8-year average, coupled with its dividend yield higher than its 8-year average.
Closing Thoughts
Just like every company, they have their fair share of strengths and weaknesses.
In terms of strengths, it will be the company having an easy-to-understand business (in that you can find its products in just about every beauty shop, or departmental stores), a steadily growing revenue, as well as its dividend payouts to shareholders over the years.
On the other hand, some of the weaknesses include a fluctuating net profit and return on equity, and also the company being in a net debt position.
Finally, at its current traded price, it is considered to be ‘cheap’ at this juncture – due to its lower than average P/B ratio, and its higher than average dividend yield.
With that, I have come to the end of my review of The Estée Lauder Companies Inc. I hope the information presented above have given you a better understanding of the company in terms of its business operations, as well as some of its key performance figures over the years.
As always, do note that all the opinions you have read about above are purely mine, which I am sharing for educational purposes only. They do not represent any buy or sell calls for the company’s shares. Please do your own due diligence before you make any investment decisions.
Disclaimer: At the time of writing, I am not a shareholder of The Estée Lauder Companies Inc.
Are You Worried about Not Having Enough Money for Retirement?
You're not alone. According to the OCBC Financial Wellness Index, only 62% of people in their 20s and 56% of people in their 30s are confident that they will have enough money to retire.
But there is still time to take action. One way to ensure that you have a comfortable retirement is to invest in real estate investment trusts (REITs).
In 'Building Your REIT-irement Portfolio' which I've authored, you will learn everything you need to know to build a successful REIT investment portfolio, including a list of 9 things to look at to determine whether a REIT is worthy of your investment, 1 simple method to help you maximise your returns from your REIT investment, 4 signs of 'red flags' to look out for and what you can do as a shareholder, and more!

You can find out more about the book, and grab your copy (ebook or physical book) here...


Comments (0)